Histograma com boxplot
histobox.RdDesenha um histograma com boxplot integrado ao mesmo gráfico
Usage
histobox(
  x,
  limites = NULL,
  col.h = "cyan",
  col.bx = "skyblue1",
  maresq = 4.5,
  mardir = 2.1,
  ...
)Examples
varnum <- rnorm(1000)
histobox(varnum)
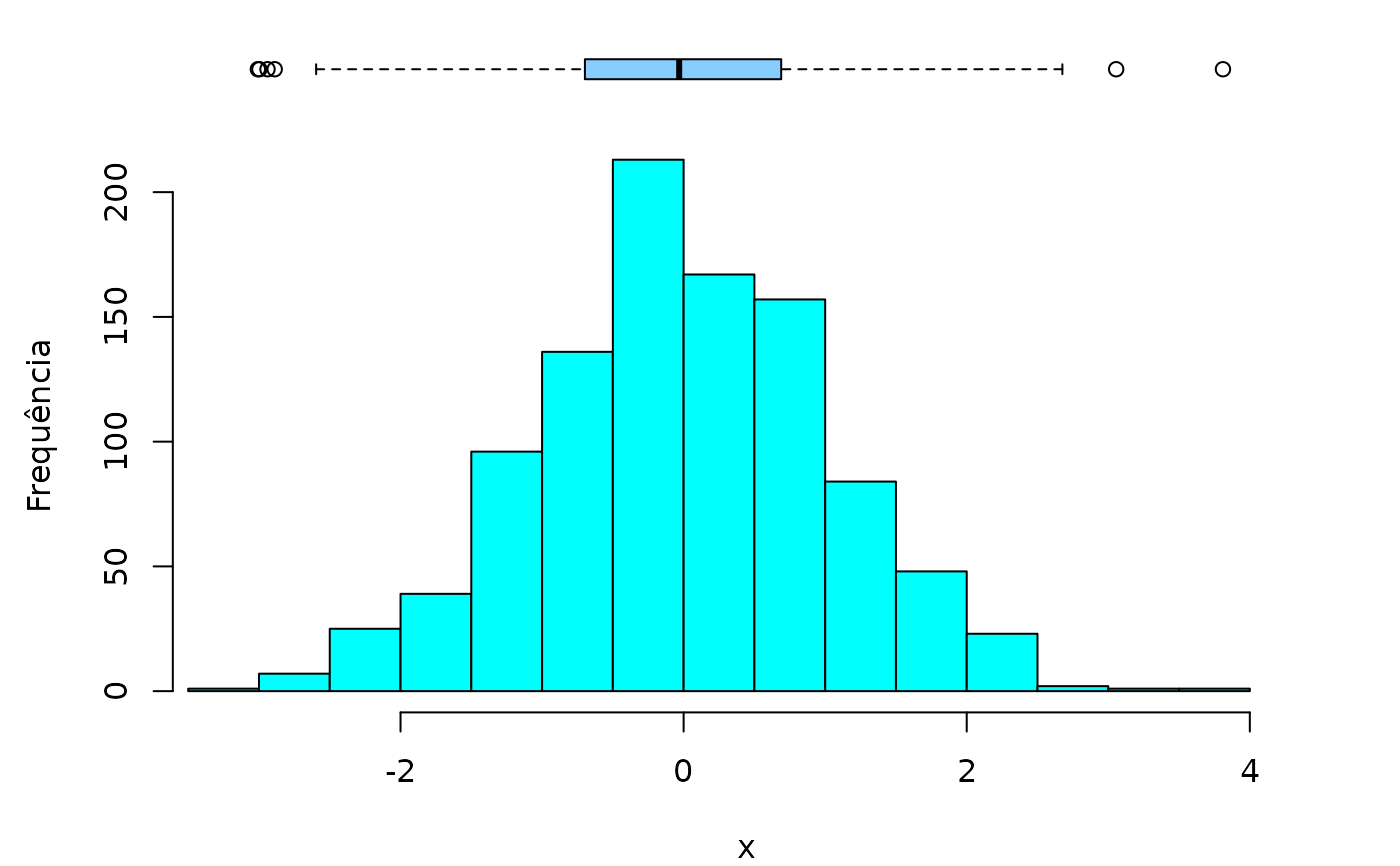
 histobox(varnum, ylab = "Frequência")
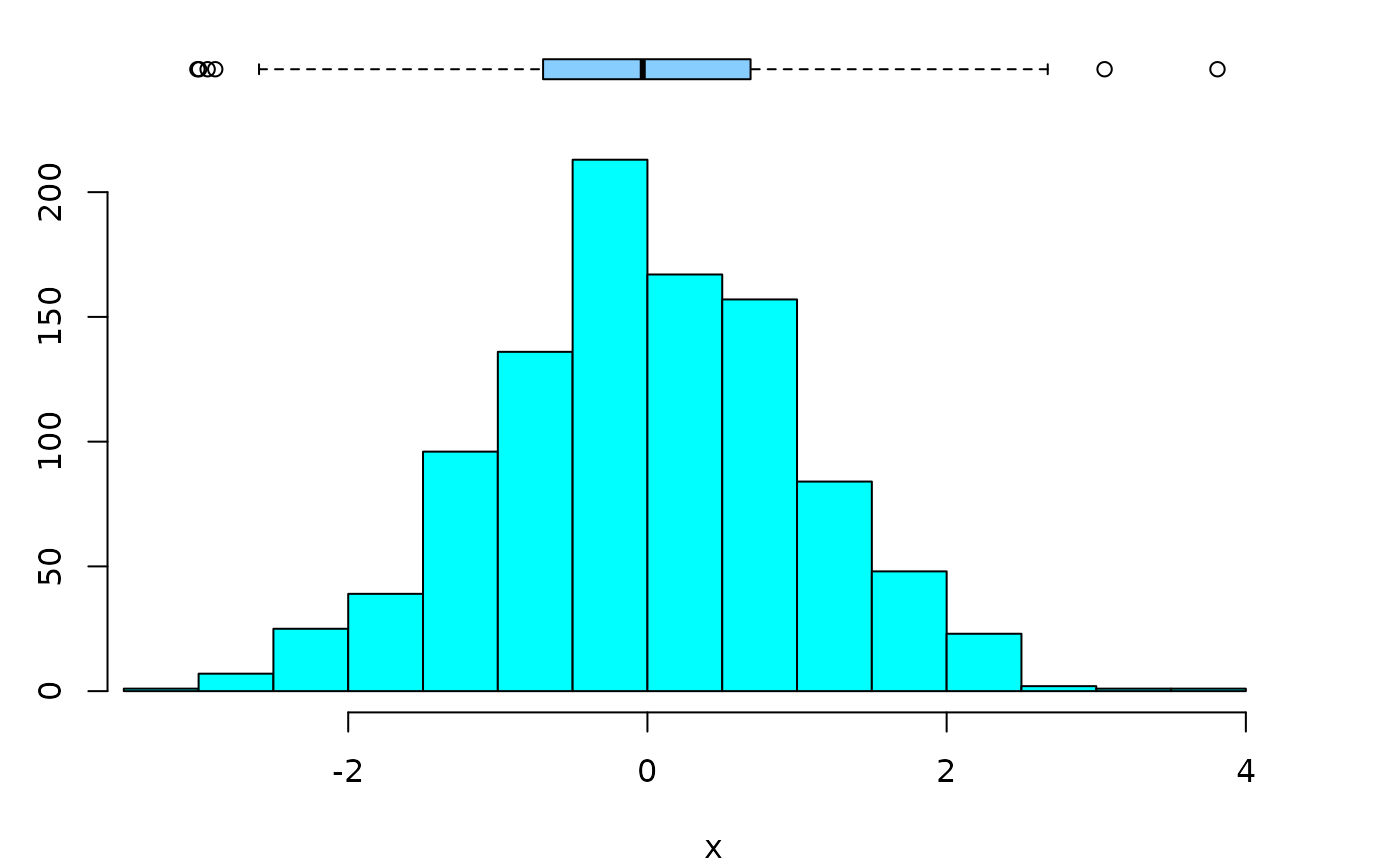
 histobox(varnum, maresq = 2.8)
 # Se a margem esquerda for zero, o eixo y é removido:
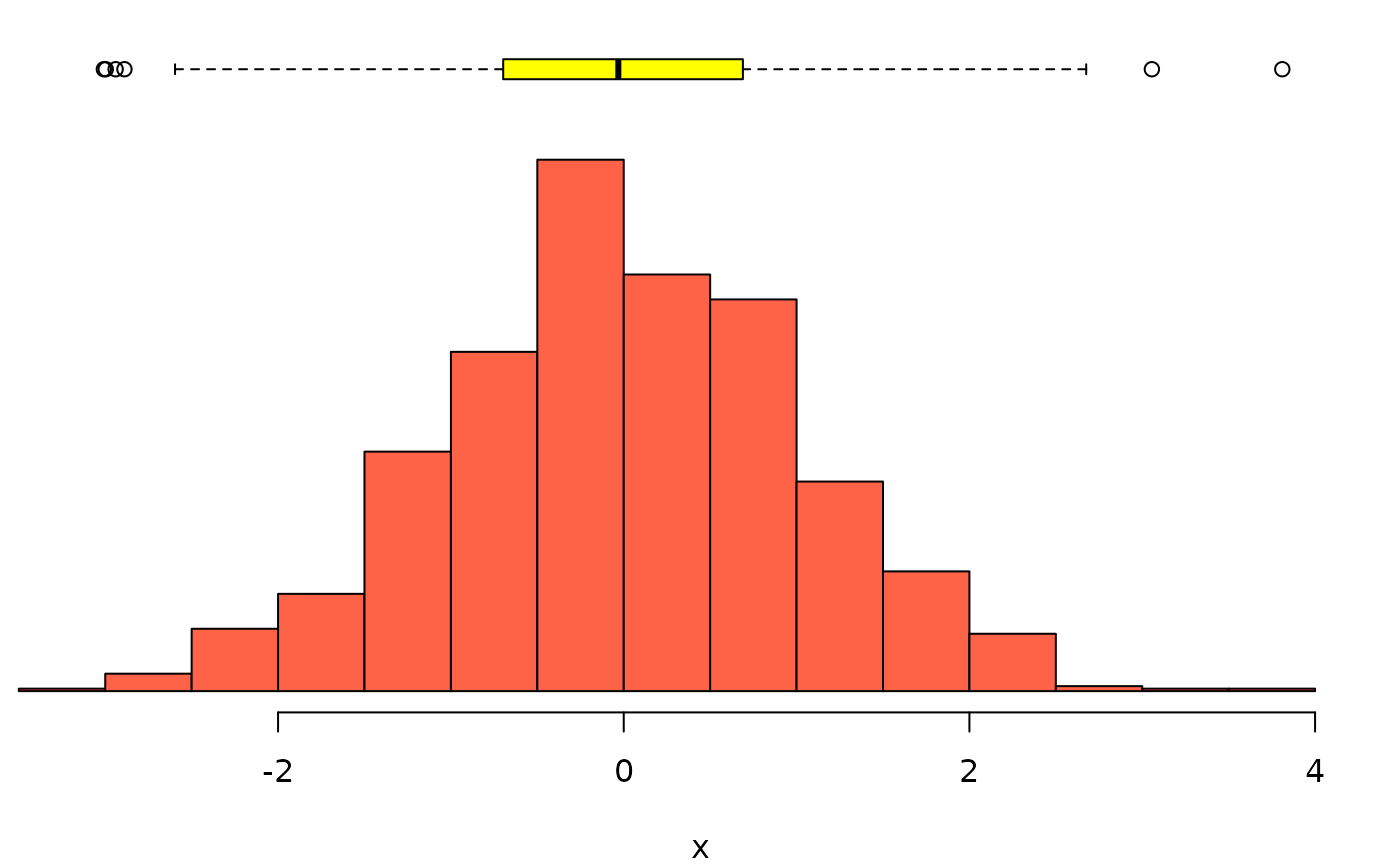
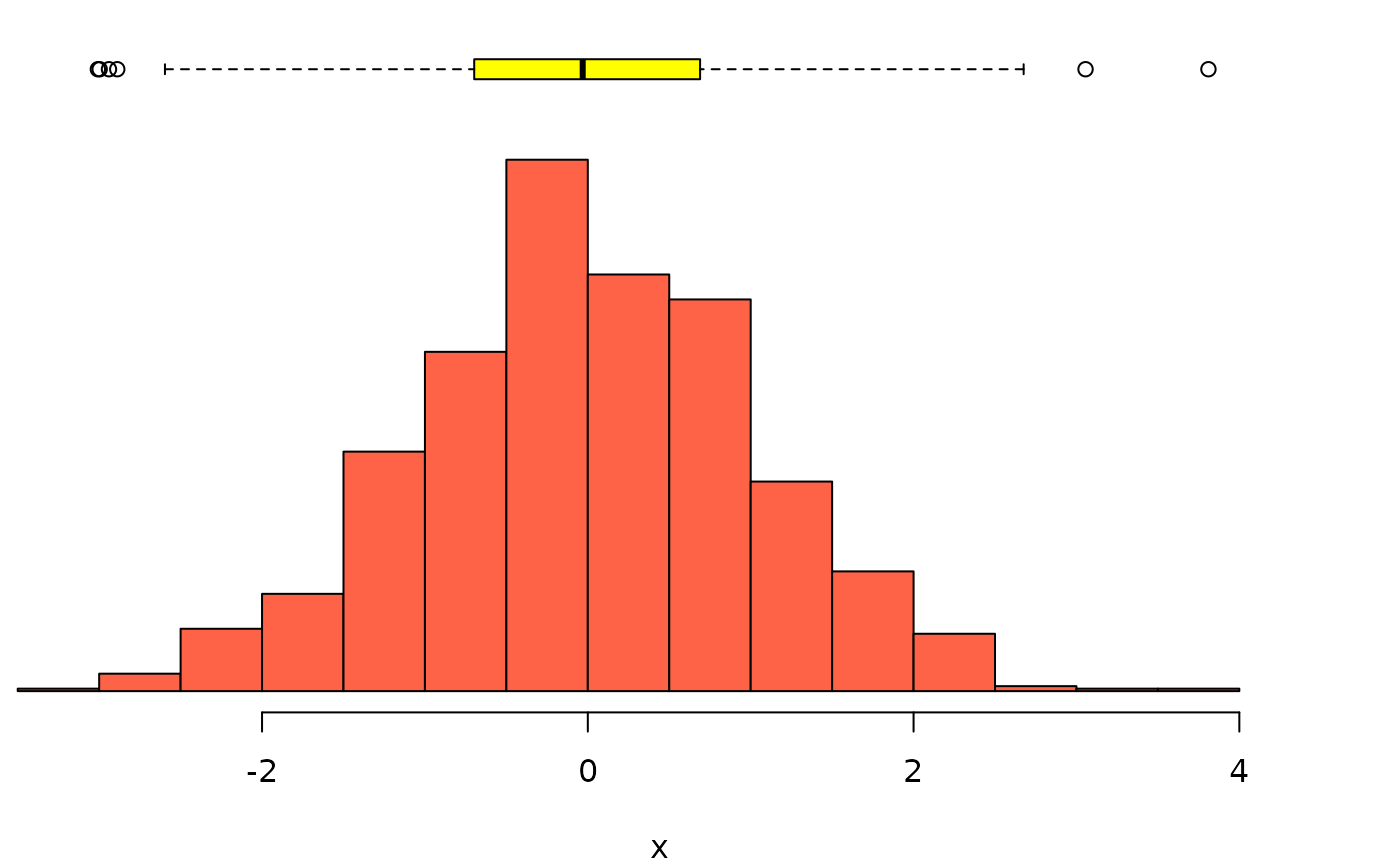
histobox(varnum, col.h = "tomato", col.bx = "yellow", maresq = 0)
# Se a margem esquerda for zero, o eixo y é removido:
histobox(varnum, col.h = "tomato", col.bx = "yellow", maresq = 0)
 histobox(varnum, col.h = "tomato", col.bx = "yellow", mardir = 0)
 histobox(varnum, col.h = "tomato", col.bx = "yellow", maresq = 0, mardir = 0)